Java Virtual Threads
Monitoring Guide

from observability to production

In this article, we will cover the virtual thread monitoring
and emit recommendations for an adoption and production usage.

It is sponsored by Worldline, as part of the Tech Squad and Innovation Labs.

Worldline logo

Jump to the interesting analysis cases or to the adoption path if you have only 2 minutes in front of you.
Otherwise, you can still check the conclusion.

Article update
Jun 2021
Jeyzer 2.4 : is now able to analyze JFR recordings and generates JZR reports out of it
Jeyzer 2.4 : agent usage is now simplified : just add the -javaagent

Introduction

Introduced in the Java 21 LTS, virtual threads (VTs) constitute a major improvement from performance and design points of view.
Nobody can ignore it for now when dealing with Java server performance.
But, as it brings additional and considerable horsepower, you MUST master the beast.
Therefore, you must be extremely careful :  a good observability is mandatory.
We may ask ourselves :  what is the state of the art of this observability ?
What should be analyzed and how ?
Finally, is it production ready and how can we adopt it on our projects ?

Java fibers!

Agenda

Let’s dive into the virtual thread world :

   1) Fundamentals     3 mn

   2) Monitored data    5 mn

   3) Monitoring    8 mn

   4) Analysis    15 mn

   5) Adoption path    2 mn

   Conclusion / Resources

1. Virtual thread fundamentals

Carrier threads

This is the VT foundation.
Carrier threads are native threads which are used to host the virtual thread execution.
Those are in a hidden pool managed by the JVM (VT engine) and are limited basically to the number of cores available (it can be tuned +/-)

Carrier thread inactive, waiting for a virtual thread to be executed

Virtual threads

We must distinguish the active from inactive virtual threads.

Inactive virtual threads are by definition unmounted.
They do wait for an event that will wake it up : IO result, sleep end…
Therefore you can have a large number of inactive VTs.
They do reside on the heap.

Inactive virtual threads

Active virtual threads do execute some code and will consume memory and CPU.
They do reside on the stack.

The VT activation requires 2 conditions :

– The event that the VT is waiting for is happening : end of sleep, IO response, reentrant lock obtained..

– The availability of an inactive carrier thread

Once those conditions are fulfilled, the virtual thread gets mounted and its activity is resumed.

Two active threads, each mounted on a carrier thread

Pinned threads

Pinned threads are VTs which are basically responsible for grabbing carrier threads.
Technically, this grabbing occurs when a VT is referencing system resources on the stack.
Risk is the asphyxia of the VT engine if its pinning is too long and too much frequent.
Note that the VT engine adapts itself to the situation by increasing the size of the carrier pool. 

A pinned thread can be either performing a native system call (ex : JNI call) or taking control of a system monitor (ex : synchronized).

In the first case (native), the virtual thread unmounting cannot occur and the thread remains “active”, mobilizing one native carrier thread. Blocking effect is 1 to 1.

In the second case (monitor), the pinning thread can be unmounted but we know it blocks other active threads waiting for the monitor it is currently holding. This is the worse case scenario because those active VTs do mobilize each one a native carrier thread. Blocking effect is 1 to N !!

Note : Java community is working actively to reduce this dependency on monitors and to manage it instead within the VT layer : the ReentrantLock for example is now virtual thread compliant.
Java 22 should bring more improvements in this area.

Two pinned virtual threads
doing probably some long native call

2. What should we monitor ?

Basically everything in a java process as usual, extended with the virtual thread layer.
We need here to understand the potential risks that we can face with the virtual threads.

  • The first one is the application collapse under load : this is classic case where physical limits get reached, such as the memory ones.
  • The second one is the underlying curbing of you application – or in other words hidden contentions – that will prevent you from taking advantage of the virtual threads : pinning (seen previously) and thread pools are typical limitations.
  • The last one is the risk put your environment at risk, assuming your application becomes extremely fast with virtual threads. In such case, an important load will be transferred to the other applications it interacts with : if those are not prepared, problems will appear in cascade.

Memory

Heap memory must be monitored.
Virtual threads do consume memory on the heap.
This may differ with the stack depth and the Java version (due to optimizations).
So if millions of threads get created, you will need to make sure that you do not reach the heap limit.

Consider also the garbage collection if your virtual threads do generate memory.
Again, millions of threads mean millions of temporary objects to get garbage collected.

Threads

Threads must be monitored to catch the internal view of what is currently executed in the JVM, by looking at the stacks and locks.
This is often left away in the monitoring because the difficulty is to get an accurate view in a jungle of cryptic stacks.
Assuming only 1-5% of the stacks present real interest, filtering it and understanding those is painful.
Fortunately, some monitoring tools do exist and Jeyzer is one of them.

With the virtual threads coming into play, it is important to see if we have contentions on :

  • Unmounted virtual threads : An important accumulation of virtual threads could imply a slowdown.
    On the opposite, if the system is under load, it’s a good activity indicator, to be linked with the memory and mounted threads.
    At last, in a “unleash the beast” scenario, you may end up with zombie virtual threads that wait for a backend that never replies/lost the query: in this case, you get an induced VT leak.
  • Pinned threads : we need to make sure that the carrier threads are not all stuck on native calls.
    In such case, a slowdown of the virtual thread activity will occur.
    Note that the rest of the Java application (non VT) will not be impacted as the OS scheduler applies a preemptive strategy.
  • Active virtual threads : this is important to see if we have a full load on the application by looking at the number of active virtual threads or carrier threads.
    Associated with a large number of unmounted threads, this could mean that we are in a Unleash the beast scenario.

CPU

We have to make sure that the carrier threads do not monopolize the CPU as it could harm the rest of the application.

Throughput

We need here to keep an eye on the application performance by looking at transaction and request statistics.
If those are bad, the previous points will need extreme attention.
If those are extremely high, you may anticipate red alerts on other applications and your application logs may show connection or remote errors.

3. How do we monitor virtual threads ?

Unfortunately, the VT monitoring layer does not meet in standard yet what we could expect to get a comfortable coverage of VTs.
We mean here at least in a production environment.

We have basically 2 distinct worlds in standard (and the good news is that Jeyzer tries to merge it for a test/production usage) :

  • The VT monitoring world provides for now only a cinematic view in a sampling approach.
    This requires to use the JCMD command line tool available in the JDK to generate thread dumps.
    We can say that we have a candle to get some light on the VTs. But a candle is quite limited, no ?
    A section is dedicated hereafter on this JCMD feature.
    Jeyzer becomes helpful here as it can analyze the JCMD recordings, display the VTs in a friendly way and generate alerts.
    Jeyzer is free and open source.
  • The usual monitoring world
    APIs and monitoring tools/agents (JFR, Jstack..) will permit to cover ONLY the native threads. This is rather bad limitation.
    So you will focus here only on the carrier threads, looking at the CPU and memory figures.
    Some VT statistics have been however introduced through the JFR events : we know how many VTs get created, terminated, pinned and failed to be submitted. This gives a vague view on the internals. Jeyzer can analyze it in a JFR recording.

Note that the VTs are accessible in remote debug, although the IDE may suffer to collect/refresh a large numbers of VTs.
This is out of scope in this monitoring article.

At the time this article is written, there is no other free tool able to monitor the VTs as far as we know.
But it should come quickly with a large Java 21 adoption.
In the meantime, you can use one of the 3 following methods.

3.1 JCMD to collect VTs

JCMD is a thread dump command line available in every JDK. You must use here at least a JDK 21.
It connects locally through the VM attach procedure and generates the output into a file.
It is limited to stacks only (VTs and native ones) : no lock information, no thread state (as you would have with jstack).

The JCMD command line to capture VTs is :

 > jcmd  Thread.dump_to_file -format=<json|txt> <process pid>

To generate some dumps in production, just wrap it in a watchdog.
To help you, Jeyzer provides a script on Windows to call it periodically and get timestamped dump files.

The JCMD output can be Json or Txt :

  • Json format provides a hierarchical view and is much more verbose, so it takes more place on disk.
  • txt format is strongly recommended because it provides a complete picture of all VTs at a given time.
    This is not the case with Json : many VTs will miss which lets suggest that this thread collection is incremental one.
    It means also that the txt format implies a stop the world event.

Note : it is also possible to print the pinned thread stacks in the output/console.
To enable it, add the -Djdk.tracePinnedThreads=[full | short] parameter to your JVM command line.
This method is interesting to identify the monitors involved a pinned situation on a ad hoc basis.

3.2 Jeyzer to collect VTs

The Jeyzer Recorder agent permits to collect VTs and standard monitoring figures.
This is excellent approach and much more suitable than the jcmd method for a test/production environment.
Basically, we have the combination of the 2 monitoring worlds described above inside a production compliant agent.

How is it realized ?
In fact, the JVM exposes a diagnostic MX API to call the Jcmd VT dump action.
Thanks to Dr Heinz Kabutz to have pointed it out to us.

But this is still generating dump files… :  not ideal. We may expect later APIs which manipulate VT stack objects.
Direct consequence is that the Jeyzer Recorder agent generates 2 files periodically : the JCMD one that contains the VTs and the JZR one that contains the system and process figures.

As usual the agent manages the ongoing recording, zipping it through a 6H rolling strategy, keeping the last 5 days (all configurable).

As reminder, Jeyzer Recorder agent parameter is :

 -javaagent:”/recorder/lib/jeyzer-agent.jar”=/recorder/config/agent/jeyzer-agent.xml;jeyzer-record-agent-profile=

3.3 Java Flight Recorder to collect VT statistics

JFR comes as a complement to the previous methods by collecting statistics.
Do not use it alone, but combine it with one of the previous described methods, in a testing context.
As an extend, you can also collect other JFR events related to the memory/CPU/Garbage collection.

The JFR VT events can be written along with the associated VT stack at the exact time of the event generation.

  • Start/stop stacks  : disable it because you will see only the fork join pool internals which are useless. 
  • Pinned stacks : those will be the ones that own a monitor or are currently on a native call.
    Unfortunately, the monitor location is not given in the stack. To get it, you must use the
    -Djdk.tracePinnedThreads=full option.

To activate the VT events, add the following  configuration elements in your JFR file :

<event name=”jdk.VirtualThreadStart“>
  <setting name=”enabled”>true</setting>
  <setting name=”stackTrace”>false</setting>
</event>

<event name=”jdk.VirtualThreadEnd“>
  <setting name=”enabled”>true</setting>
<setting name=”stackTrace”>false</setting>
</event>

<event name=”jdk.VirtualThreadPinned“>
  <setting name=”enabled”>true</setting>
  <setting name=”stackTrace”>true</setting>
</event>

<event name=”jdk.VirtualThreadSubmitFailed“>
  <setting name=”enabled”>true</setting>
  <setting name=”stackTrace”>true</setting>
</event>

3.4 VT monitoring impact

Both above collection methods rely on the same thread dump file mechanism and therefore share the same limitations.
Basically, monitoring thousands of VTs at a given time is acceptable, like you could do with native threads. Millions would be definitively problematic.
Regarding the JFR additional usage, it should be first tested as it could generate a very large number of VT events over time. 

  • Disk space : dump files can be huge as each VT gets written.
    Plan several Mbs per file for few thousands of VTs. Prefer the txt output format as it is less verbose.
    As mentioned previously, the Jeyzer Recorder is providing additional zipping.
  • Performance : not yet assessed but of interest and we’ll keep an eye on it.
    Note that Java 22 will introduce significant performance optimizations on the dump generation (up to x5 according to Heinz Kabutz).
    From what has been observed :
    – The txt dump generation seems to perform a stop the world (STW) operation as it captures an exhaustive image of the VTs which is valuable.
    – The json dump generation output takes more time but is done in an iterative way which suggests that it is done in background. It captures less VTs (seen under Windows with Openjdk 21).
    This STW versus iterative behavior is guessed when looking at the carrier threads and VTs. In txt dump format, the number of active VTs is always equal to the number of carrier threads, which is not the case with Json.

4. How do we analyze virtual threads ?

In standard, there is no analysis tool : you must do it manually by looking at the JCMD thread dumps.

Another approach would be to use the Jeyzer Analyzer to get a JZR report starting from JCMD dumps or directly from a JZR recording.

In addition to one of the above methods, you could then couple it with a Java Flight recording (JFR) analysis to get the VT event statistics and standard CPU/memory/GC figures, by using the Java Mission Control (JMC) or the Jeyzer Analyzer.

Note : the below analysis cases are illustrated with Jeyzer VT demo ones.

4.1 Virtual thread dump analysis (manual)

Let’s see what we have in a txt VT dump generated with the JCMD tool (JDK 21).
We assume that we perform some dumps at regular interval to get a good coverage.

#3151 "" virtual
      java.base/jdk.internal.vm.Continuation.yield(Continuation.java:357)
      java.base/java.lang.VirtualThread.yieldContinuation(VirtualThread.java:428)
      java.base/java.lang.VirtualThread.parkNanos(VirtualThread.java:599)
      java.base/java.lang.VirtualThread.doSleepNanos(VirtualThread.java:777)
      java.base/java.lang.VirtualThread.sleepNanos(VirtualThread.java:750)
      java.base/java.lang.Thread.sleep(Thread.java:557)
      org.jeyzer.demo.virtualthreads.TestSequence.sleep(TestSequence.java:30)
...
java.base/jdk.internal.vm.Continuation.enter0(Continuation.java:327)
java.base/jdk.internal.vm.Continuation.enter(Continuation.java:320)

The above stack represents a virtual inactive thread.

We notice :

  • The “virtual” keyword in the header

  • The absence of a thread name that should appear in the “”.
    Note that virtual thread naming is possible : see the recommendations section.

  • The code stack is classic and shows that the thread is inactive :
    • the Thread.sleep which is at the origin of this inactivity.
    • the Continuation.yield call indicates that the thread is suspended, waiting for the end of the sleep.
    • The Continuation.enter at the top level is the virtual thread envelop, somehow the equivalent of Thread.run for a native thread.
Virtual stacks suspended on the same code point will generally fill the dump file : same stack, only the #id will change.
 
Analysis : 
  • Group the threads by identical stack and do a count for each group.
  • Understand the cinematic of each group like you would do for native threads. Is there any abnormal suspended activity ?
    For example, do we have a functional contention (ex: database call, access to a pool..) ?
  • Think about the occupied memory for each group. The JFR analysis could help you to get the memory view at that time.
#12800 "" virtual
java.base/java.util.Random.next(Random.java:444)
java.base/java.util.Random.nextDouble(Random.java:698)
java.base/java.lang.Math.random(Math.java:893)
org.jeyzer.demo.virtualthreads.CPUWorker.consumeCPU1(CPUWorker.java:94)
org.jeyzer.demo.virtualthreads.CPUWorker.work(CPUWorker.java:73)
org.jeyzer.demo.virtualthreads.CPUWorker.lambda$run$0(CPUWorker.java:46)
java.base/java.util.concurrent.ThreadPerTaskExecutor$ThreadBoundFuture.run(ThreadPerTaskExecutor.java:352)
java.base/java.lang.VirtualThread.run(VirtualThread.java:305)
java.base/java.lang.VirtualThread$VThreadContinuation.lambda$new$0(VirtualThread.java:177)
java.base/jdk.internal.vm.Continuation.enter0(Continuation.java:327)
java.base/jdk.internal.vm.Continuation.enter(Continuation.java:320)

The next one (above) is a stack for an active virtual thread.
We notice :

  • The code stack is now executing some real operation such as a random generation here.
  • The “virtual” header keyword and the Continuation.enter envelop
The maximum number of virtual active stacks will usually correspond to the number of CPUs.
 

Analysis :

  • For a given action, compare it with the suspended threads that have similar smaller stacks and which therefore wait to be mounted.
    We want to check here that the pool of active threads is able to handle all the suspended threads and does not constitute a bottleneck.
  • Do we have multiple threads blocked on a Java lock ?
    You need to find the stack which holds the lock. It may have a slightly different stack.. or not if the execution path goes elsewhere.
  • Do we have multiple threads blocked on a synchronized section ?
    Unlike the locks, synchronized code cannot be clearly identified in a stack : it has to be guessed.
    Here, search for all the stacks that have an identical stack : you should find one with a slightly longer stack.
    This stack/thread owns probably the monitor : if it is unmounted (sleeping for example), try to understand why. It may hide a bad design.

This time, let’s have a look at the carrier active thread below.
We notice :

  • The header indicates that the carrier thread is a member of fork join pool.
  • The Continuation.run is telling us that the carrier thread is executing some virtual thread code.

Analysis :

  • Count the number of carrier active threads and compare it with the number of CPUs.
    If almost equivalent, check the virtual active threads and discard the ones which are in a pinned situation (system calls here).
    If almost equivalent, then your virtual threads are CPU bound.
    As an immediate step, you could reduce the maximum limit of carrier threads with the 
    -Djdk.virtualThreadScheduler.maxPoolSize=value
    The idea is to give some bandwidth – some controller scheduling space basically – to the rest of the application to get the native threads executed on time.
    As a further step, you should ask yourself if this strong CPU usage is expected. Is it a bad regular expression for example ? 
    At last, virtual threads are by nature not expected to be CPU bound : they have been designed initially for wait/IO interruptions.
#10764 "ForkJoinPool-1-worker-9"
      java.base/jdk.internal.vm.Continuation.run(Continuation.java:260)
      java.base/java.lang.VirtualThread.runContinuation(VirtualThread.java:216)
      java.base/java.util.concurrent.ForkJoinTask$RunnableExecuteAction.exec(ForkJoinTask.java:1423)
      java.base/java.util.concurrent.ForkJoinTask.doExec(ForkJoinTask.java:387)
      java.base/java.util.concurrent.ForkJoinPool$WorkQueue.topLevelExec(ForkJoinPool.java:1312)
      java.base/java.util.concurrent.ForkJoinPool.scan(ForkJoinPool.java:1843)
      java.base/java.util.concurrent.ForkJoinPool.runWorker(ForkJoinPool.java:1808)
      java.base/java.util.concurrent.ForkJoinWorkerThread.run(ForkJoinWorkerThread.java:188)

4.2 Virtual thread analysis with Jeyzer

Let’s see what we have in a JZR report generated with the Jeyzer Analyzer.
Analysis material can be a sequence of Jcmd virtual thread dumps or a JZR recording (which adds ad minima system and process figures) obtained with the Jeyzer Recorder agent.

Note : JFR recording could be used but it unfortunately does not record the virtual threads.

To generate the JZR report, we’ll follow the classic way : 

  • The Jeyzer Web Analyzer is started. This is a Tomcat based web app.
  • We connect to the Jeyzer Web Analyzer interface with our favorite web browser.
  • We upload the zip recording : either the Jcmd dumps or the JZR recording.
  • We trigger the generation : the JZR report link appears. We download it.
As reminder, the JZR report is an Excel report, providing different views (sheets) on your monitored Java application.
You can share it, email it, put it on JIRA. Good diagnosis report.
 

The JZR report gives the following advantages detailed below : the VT display and the detection of important events (VT related or not).

4.2.1 Optimized virtual thread display

594 unmounted virtual threads are currently sleeping at that point in time. They do share the same stack.

On a time sequence, the VTs get displayed with the native threads. 
As usual, you get the technical information abstracted : high level action (ex: execute a payment), low level action (ex : database access) and the contention type (ex: network, database, computing, file access…). The stacks are displayed as cell comments.

To display the VTs, 2 design choices have been performed:

  • Identical unmounted virtual threads are grouped and a thread counter suffix is displayed on each cell.
    Reason : if you have thousands of inactive threads – sleeping for example – you would like to see only one for readability reasons.
    Because it is grouped, you will get one line over time, making it more easy to read.
  • Carrier threads are not displayed.
    Reason : as we have the related active VTs, there is no need to display the underlying carrier threads.
    Also those carrier threads do not carry the processing information which gets abstracted by Jeyzer. 

4.2.2 Detection of issues

The Jeyzer Analyzer applies a large set of detection rules upon the recording which generate events.
Those events are displayed in a dedicated sheet(s) in the JZR report, either listed or displayed on a time sequence.
Events can concern various domains : contention types, memory, CPU, garbage collection, intensive usages, thread leaks.. and now virtual threads.
Note : in an advanced manner (using the Jeyzer Monitor), those events could also be dispatched as alerts by email, to JIRA, Zabbix or simply displayed in a web radiator page.

Virtual related thread events are :

  • Global virtual thread limit : to detect a sudden virtual thread creation burst due to high activity peak
  • Virtual thread presence : let’s make sure that our VTs are here.. or may be the opposite if you embed a framework that silently creates VTs in a purely native application.
  • Virtual thread leak : under high stress, some end points may not react correctly.
    If something is going wrong in a pseudo reactive model, you may end up with virtual threads that will never get their IO answers for example.
    It’s important therefore to detect those pseudo VT leaks.

 More ever, let’s cover the basic events which can be interesting when dealing with VTs: 

  • Contentions : detect sudden burst and contention on a pool or database access for example. Can be global or at the action level.
    Some global rules are there in standard (database and logging). Must be tuned/completed otherwise.
  • CPU consuming system (*)
  • CPU consuming process (*)
  • Excessive GC time : only possible with a JZR recording (*)
  • GC failing to release memory : the out of memory case (*)
  • Frozen stacks: detect long running threads executing the same executable code.
  • Memory consuming system (*)
  • Memory consuming process (*)
  • Open file descriptor percentage. Unix only (*)
  • Process settings : checks on Java parameters, libraries…
  • Various types of events such as process restart, process up time..
(*) Only possible with a JZR recording.

4.2.3 Case : Inactive virtual threads

Stack is showing an IO access.
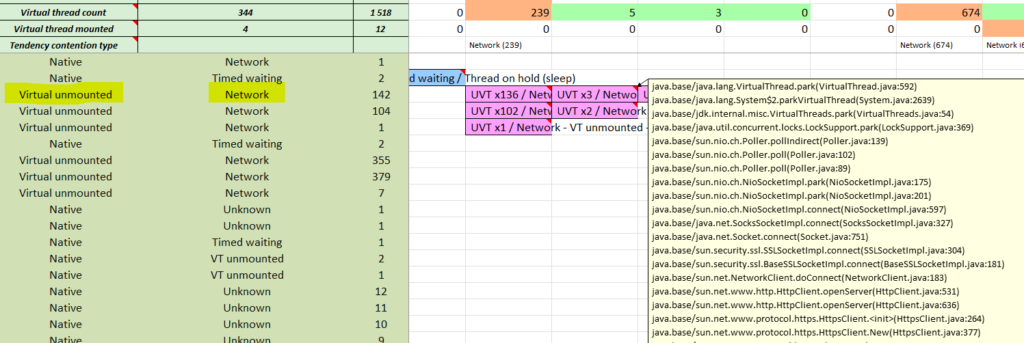
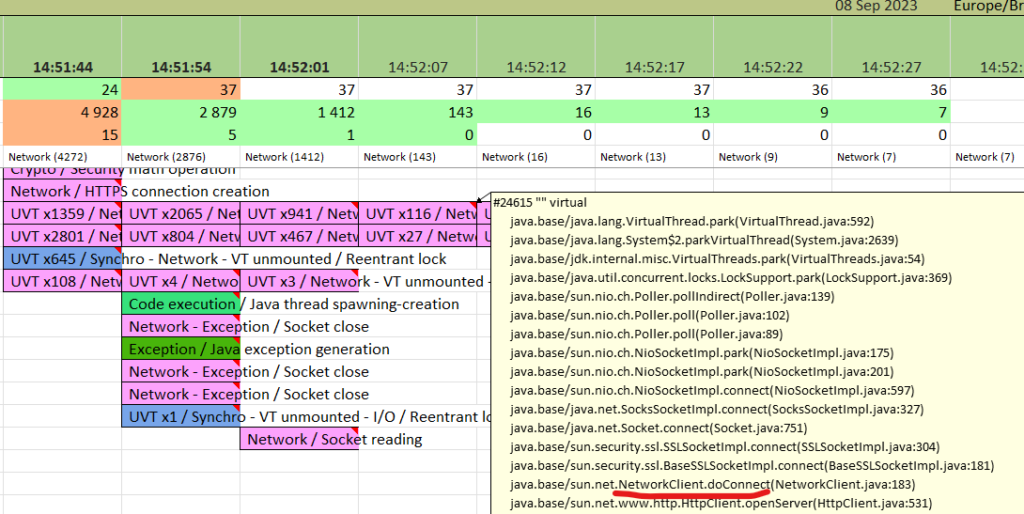
Related threads (136) are unmounted, waiting each one for an HTTP connection to be established.
At later point, we have still 3 threads in this situation.
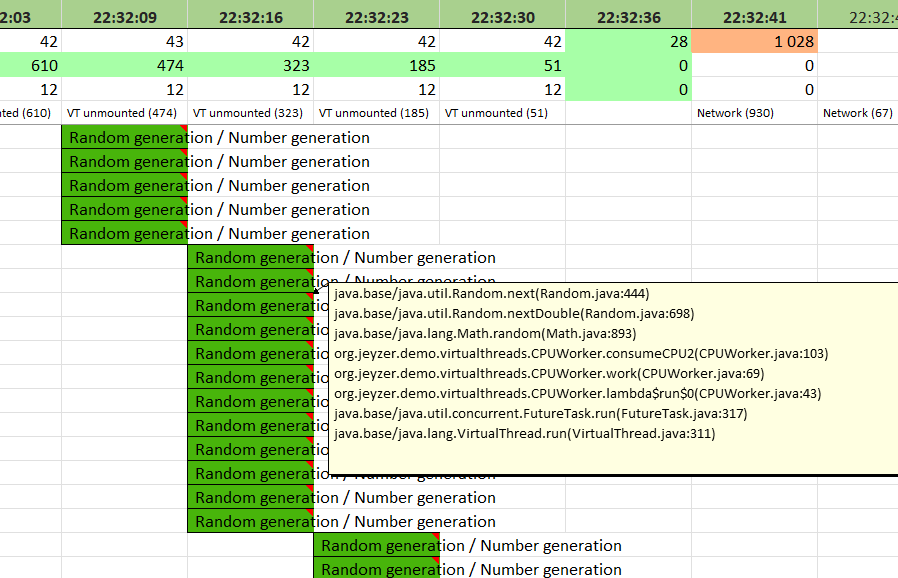
We can see at the top that we have zero mounted threads : all the activity is network related !

Inactive virtual threads are grouped by identical stack.
Thread count is suffixed.
An accumulation of those may not be ideal.

The above example shows VTs that do wait for IO responses.

4.2.4 Case : Active virtual threads

Mounted virtual threads are displayed as single entries.
You immediately spot the type of action and contention.

This screenshot shows 12 active virtual threads executing some random number generation (cf.stack). Green color means runtime execution.

Note the absence of grouping : each active thread is displayed alone with its own stack.
In the header section,  the mounted thread counter is 12 which is basically the number of CPUs on this server : process is under CPU stress !
Also the contention tendency is set to VT unmounted (474 VTs waiting). We could deduce those – not visible here but displayed upper in the report- are waiting to be executed.

4.2.5 Case – Virtual threads pinned

Mounted virtual threads can be locked or blocked on a synchronized : this is a situation to avoid.
If the VT is pinned on a Java lock, you’ll get the information in the report.
Otherwise, because the VT dumps do not provide any locking information, you must check the source code to confirm it.

Below example is based on several threads blocked by a synchronized.
For educational demo purpose, you can see it released one by one, leading to a stair effect.

The stack of the grey cell shows a thread blocked on a synchronized section (as per demo code).
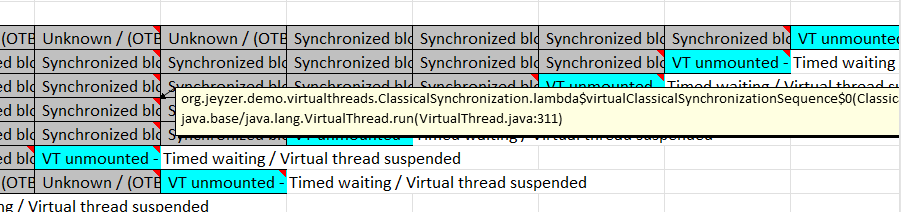
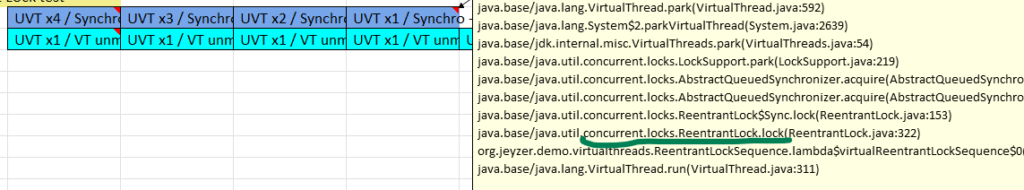
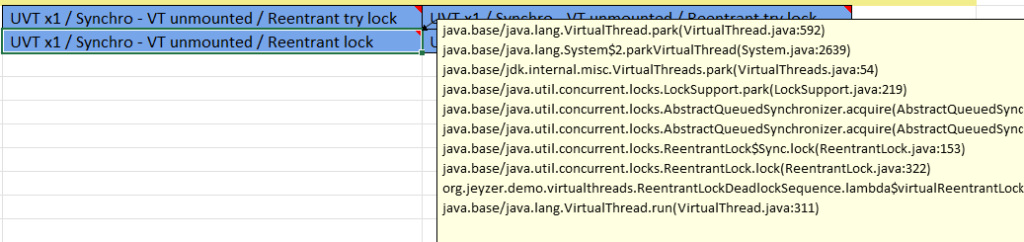
The pinned thread is the one in blue ! Because it holds the monitor.
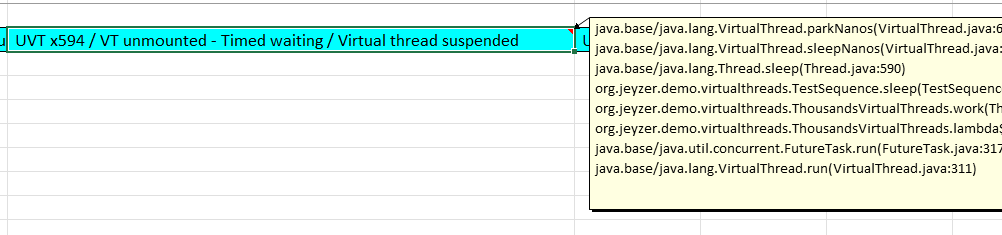
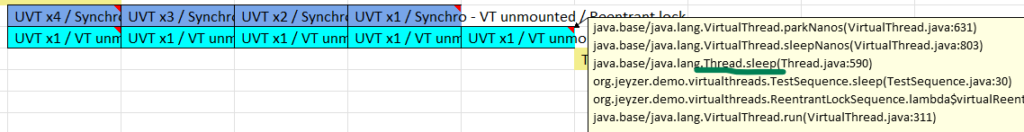
That one is performing a sleep : it is therefore unmounted (blue).
The grey ones are active virtual threads which are mobilizing - each one - a native thread : not really good !
You can see the stair effect as each thread gets - one after the other - the monitor, wait a few seconds and terminate.
Nothing indicates the synchronized, it's only by looking at the stacks that you can guess it.

4.2.6 Case – Virtual thread reentrant lock

The ReentrantLock class implements the VirtualThreads.park which permits to unmount the thread while waiting to obtain the lock. This is is the correct way to lock resources with virtual threads (and do not fall into a pinned situation).
Reentrant lock - locked threads are unmounted
Reentrant lock - locker thread does a sleep and then releases the lock

4.2.7 Case – Virtual thread deadlock

Mounted virtual threads can be in a situation of deadlock. Because the VT dumps do not provide any locking information, you will have to dig into the source code to confirm it. 

The 2 threads on the right are in deadlock : nothing indicates it !! The deadlock is performed here with 2 reentrant locks. Note that the 2 threads are unmounted in this case. A try lock is performed by the 2nd thread to force the deadlock end.
Deadlock - A side
Deadlock - B side

4.2.8 Case – Virtual thread leak

Initial situation : Jeyzer demo connects intensively to an HTTP server - Unmounted threads wait for the HTTP connection establishement

This situation can appear under high stress when any end point – accessed by the VT – starts to lose requests.
In such case, virtual threads may be waiting endlessly for an IO response, leading therefore to a pseudo VT leakage.
The following example has been observed under Windows under IO stress when accessing an HTTP server.
It has not been determined so far if the JVM or remote HTTP server was responsible for this request loss.
However, the same issue has been reproduced with a 
native threads with a large thread pool executor : it demonstrates that the VT layer is not the root cause. 

Pseudo VT leakage : 5 minutes later, 1 unmounted VT is still waiting for an HTTP connection
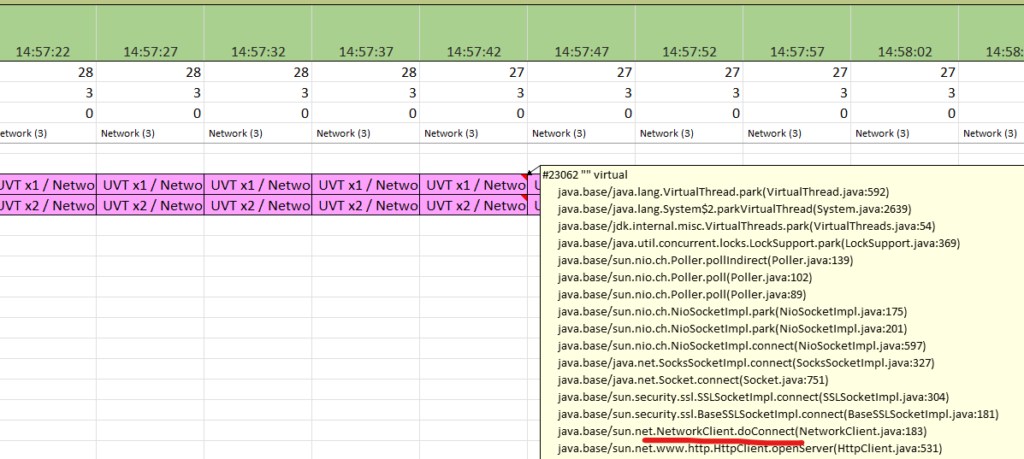
and the 2 other unmounted VTs - on the following line - still wait for a SSL handshake

4.3 JFR VT stats analysis

The JFR recording will contain the VT related events, detailed hereafter.
Because VT stacks cannot be dumped in a JFR recording 
(as for now with Java 21), the analysis will be quite limited.
You will basically see the carrier threads running without knowing exactly what those are executing.

You can use Java Mission Control or also the Jeyzer Analyzer for the analysis.
For more detail, see our special article on the JFR analysis.

4.3.1 VT start/stop JFR events

Analysis : the interest of these events is purely for statistical reasons.
Over a period of time, do the difference (delta) between the number of start and end events.
Do we create more VTs than terminating it ? Do we go beyond some VT volume threshold ?

4.3.2 VT pinned JFR events

Analysis : if those events are too frequent, you must look at Jcmd periodic thread dumps or at the JZR report. Why ? events occur at any time and the pinned effect could immediately disappear in the following milliseconds. It therefore gives a first impression. A sequence of dumps (or a JZR report) will give you an accurate picture at various points in time. Based on these events :
  • If the event stack relates to a system call like JNI, look at similar stacks in the Jcmd dump/JZR report. Those are active threads.
  • If the event stack relates to a lock or a monitor, check how many active threads get blocked by it in the Jcmd dump/JZR report.
 With these checks, we must make sure that we do not exceed too often the number of CPUs. If the case, the VT layer performance will collapse, leading to a large number of unmounted VTs and memory problems.

4.3.3 VT submission failure JFR events

Analysis : presence of such events requires some investigation, even if its number is low.

5. Virtual thread adoption path

We must consider the virtual thread usage and its observability.

5.1 VT usage

  • VTs should be used for I/O wait operations, basically as an excellent replacement for reactive and asynchronous programming.
    Do not use it for CPU bound operations : prefer native threads instead.

Introducing VTs in an application is really easy from a coding perspective.
Also, some frameworks like Quarkus or Springboot offer it now with just a Java switch or through annotations.

The real risk here is the performance runaway or the “Unleash the Beast” scenario.

Because no limitation exists in the VT framework, the application could create a huge number of VTs under peaks of activity with a wrong design/coding.
Without any care, you could end up in global system instability, putting also at risk the external applications which get called by the VTs.

So the recommendations are :

  • Identify the VT usage in place (or potential) in your application.
  • Protect it against a sudden burst : add throttling code for example (a Semaphore can make it).
  • Run performance tests and benchmarks. Do not wait for a critical production case.
    Use the Jeyzer Analyzer to study the VT cinematic. Resolve the pinned situations.

The opposite case to the “Unleash the beast” risk is the slow down :

  • Make sure that locks, native calls or synchronized sections will not be a contention point.
    Find alternatives otherwise. The ReentrantLock is a good solution when locking is required.

At last, general recommendations are : 

  • Stay tuned and look at Java VT new features : StructuredTaskScope, VirtualScope are for example promising pieces, so far experimental. The StructuredTaskScope permits to execute a flow of threads (various tasks) as logical unit, allowing “on error/success” result strategies. VirtualScope is an alternative to ThreadLocal, to be combined with the StructuredTaskScope.
    The synchronized pinning will also be addressed in a future release. StructuredTaskScope is VT based.
  • If you plan to use VT based frameworks, understand its underlying VT usage and read related performance articles.
  • Name the virtual threads and pools.
    The ThreadFactory provides the possibility to name it either directly or combined with a StructureTaskScope.
    Full example :
    new StructuredTaskScope<Image>(“Image downloader”, Thread.ofVirtual().name(“download-request-“, 1).factory()

5.2 VT monitoring

Because the VTs open the door to a wide thread usage, you must have now a view on the VM internals on top of the classical Java memory/CPU/garbage collection figures.

Monitoring is largely possible in the coding and testing phases.

Extending it to a production environment can be problematic :

  • The Jcmd requires a JDK.
    It’s unfortunately not always possible to deploy a JDK in production for security reasons.
    Although this is a manual tool which require human analysis.
    You would then use it only on occasional basis.
  • Jeyzer is adapted for production from the beginning to get a full runtime coverage and analysis.
    But, like for any new observability product, it requires to pass any company security validation.
    Also DevOps / SysOps must also adopt it and possibly integrate it in any existing APM such as Zabbix (which is now possible with Jeyzer 3.2).
If the above is not possible, default path would be then to wait for the VT support in your APM solution.

5.3 VT adoption strategy

In the current state of the art, we recommend :

  • On new projects, go for Java 21 VT usage. It will be better than reactive coding at least in term of coding, and monitoring afterwards.
    Of course, apply the VT coding rules and make sure to control the VT Beast.
  • On existing projects, evaluate the cost to migrate (may be you start from Java 8..) and establish an early performance benchmark with VTs.
    If you upgrade a framework that supports now VTs, make sure to test the performance impact under stress, otherwise disable in production.
  • Keep an eye on the Java updates. Promising new VT features  – from both coding and monitoring aspects – will end up in the Java 25 LTS (released in 2025).  But we could expect those to be back ported in Java 21 LTS updates.
  • In production, the time will come where a full suite of tools/API will permit to monitor perfectly the VTs under all angles.
    Again, let’s light a candle to get it in Java 21 LTS updates.
    In the meantime, you may use Jeyzer if you are ready to allocate some effort to adopt it.

Conclusion

We hope this VT monitoring guide will help you in your daily work, from the design phase to the production.

Starting from Java 21, virtual threads are definitively now a master piece for applications that require performance.
Those will surely progressively over seed the reactive programming practices because standard, more simple to use/debug and guaranteed to evolve positively on the long term. 

In the observability domain, we have seen that there is still room for improvement in the virtual thread world.
What is provided in standard remains basic : we could expect for example a better support in Java Flight Recorder.
In the meantime, Jeyzer can become a good ally in your performance analysis and/or monitoring by providing analysis reports and features/bridges for online monitoring.

So do not hesitate to jump on the VT journey, especially on new Java projects.
And make sure to have the right monitoring tools depending of how critical/complex/performant your application must be : this will ensure its final success in production.

Thanks for your reading and time.
Special thanks to Heinz Kabutz, José Paumard for their help,
and Jean François James and Dalilah Hattab at Worldline for their support and contribution to innovation.