Jeyzer blog

End of service
This is now time for retirement : the Jeyzer web site will shutdown end of February.
Thank you for your support during all those years !!

Virtual Thread monitoring guide
Check out our Virtual Thread monitoring guide article.
Following the virtual thread recording and analysis support in Jeyzer, the need for a monitoring guide became obvious to close our virtual thread journey.
This guide is quite exhaustive and contains recommendations for the virtual thread adoption.
Highly recommended.

Jeyzer 3.3 - Zabbix integration
Jeyzer 3.3 – maintenance release – is now available in the download section.
- Active monitoring : Zabbix integration improved
Jeyzer Monitor can export detected events to Zabbix in order to send alerts or to display it in Grafana.
This is achieved with the combination of a Jeyzer Publisher and a Zabbix sender client.
Jeyzer 3.3 improves the feature with JSON messages for Zabbix (which permit direct integration in Grafana).
Operations and contention types can now be exported on the long running task events : very useful info in a Grafana dashboard. - Jeyzer in numbers :
Jeyzer now includes 128 technical shared profiles : from Apache Commons, MySQL, Log4j… to Hadoop, JBoss, Tomcat, Spark…
Online Analysis now performs 192 checks on your submitted runtime recordings.
And Jeyzer 3.3 comes up with 99 detection rules to use directly or customize.

Jeyzer 3.2 - Virtual Thread recording and Zabbix integration
Jeyzer 3.2 is now available in the download section.
- Jeyzer can now record Java virtual threads
Introduced in Java 21, virtual threads are now a Java masterpiece, bringing high end performance and simplifying the asynchronous programming.
After introducing the virtual thread analysis, Jeyzer is now able to record it using a Java agent (aka Jeyzer Recorder agent). This is truly a better alternative to the Java jcmd command line tool and it brings also the advantage to capture along side standard figures (CPU, memory, GC). - Active monitoring : Zabbix integration
Jeyzer Monitor can now export detected events to Zabbix in order to send alerts or to display it in Grafana.
This is achieved with the combination of a Jeyzer Publisher and a Zabbix sender client. - Jeyzer in numbers :
Jeyzer now includes 120 technical shared profiles : from Apache Commons, MySQL, Log4j… to Hadoop, JBoss, Tomcat, AppDynamics…
Online Analysis now performs 187 checks on your submitted runtime recordings.
And Jeyzer 3.2 still comes up with 98 detection rules to use directly or customize.

Jeyzer 3.1 - Virtual Thread analysis
Jeyzer 3.1 is now available in the download section.
- Jeyzer can now analyze Java virtual threads
Introduced in Java 21, virtual threads are now a Java masterpiece, bringing high end performance and simplifying the asynchronous programming.
In the JZR reports, you will visualize easily the grouped unmounted virtual threads and the individual running virtual threads.
Through the Jeyzer Monitor, you may trigger events such as virtual thread max threshold or “leak” detection.
As of today, the Java Jcmd tool is mandatory to capture virtual threads : the Jeyzer Recorder is embedding a periodic one for Windows.
At last, if you wish to play around with virtual threads, the Jeyzer Demos provide a set of interesting tests : massive creation, IOs, locks… - Jeyzer in numbers :
Jeyzer now includes 104 technical shared profiles : from Apache Commons, MySQL, Log4j… to Hadoop, JBoss, Tomcat…
Online Analysis now performs 167 checks on your submitted runtime recordings.
And Jeyzer 3.1 comes up with 98 detection rules to use directly or customize.

Jeyzer 3.0 - Open Source release
Jeyzer 3.0 is now available in the download section.
- Jeyzer is now entirely open source
The Jeyzer Monitor license is not required anymore starting from version 3.0.
Jeyzer release cycle will now be biannual. - Jeyzer in numbers :
Jeyzer now includes 99 technical shared profiles : from Apache Commons, MySQL, Log4j… to Hadoop, JBoss, Tomcat…
Online Analysis now performs 161 checks on your submitted runtime recordings.
And Jeyzer 3.0 comes up with 93 detection rules to use directly or customize.

Jeyzer 2.7 release
Jeyzer 2.7 is now available in the download section.
- NEW : Java 17 LTS support
Jeyzer is certified on Java 17. It includes The Jeyzer Analyzer, Jeyzer Recorder and Jeyzer Monitor.
Jeyzer therefore covers the incident analysis and monitoring of Java server applications running from Java 7 to Java 17 !! - Maintenance release
The JZR report has been enhanced with minor improvements on the JVM flags, Session Details, Top Stacks and Process Card sheets.
It contains also bug fixes, including ones related to the JFR analysis.

Jeyzer 2.6 release
Jeyzer 2.6 is now available in the download section.
- NEW : Group sequence sheet
Your application is using a large set of active threads ? And this is painful to browse in a JZR report (even if Jeyzer already filters the inactive threads) ?
The JZR report provides you with a new view which groups the identical thread stacks to facilitate strongly the analysis.
1000 identical active threads will be typically displayed as 1 line in the JZR report !! - NEW : Profile redirection
The Jeyzer Web Analyzer is detecting the right analysis profile to use, thanks to the new profile redirection feature.
For example, analyze any JFR or JZR recording of Active MQ : Jeyzer will scan it and select automatically the AMQ analysis profile.
That way, you get now transparently the best JZR report that suits to your application.
Note : the Jeyzer Online Analyzer is also supporting this great feature for a few standard master profiles (which include AMQ). - Java Flight Recorder support : the Jeyzer Analyzer accepts now any zipped JFR recording file.

Jeyzer 2.5 release
Jeyzer 2.5 is now available in the download section.
- The Java Flight Recorder support is extended with the JVM flags analysis
and the date display in any time zone (opposed to JMC which does only UTC display) - Time zone selection : JZR reports and outputs can now be aligned on any time zone
- JVM flags are now recorded , analyzed and subject to monitoring rules

Jeyzer 2.4 release
Jeyzer 2.4 is now available in the download section.
- A major step is reached with the Java Flight Recorder support : Jeyzer can now analyze JFR recordings and issue JZR reports out of it.
- The Jeyzer Recorder Agent integration has been extremely simplified : add the -javaagent[…] to your Java command line and it is ready !

Jeyzer and Java Flight Recorder
This led us to put the light on the 2 solutions and compare it in this article.
The study covers the black box recording and its analysis where the JDK Mission Control is also involved.

Jeyzer 2.3 release
It is a minor version, strongly recommended for any application running under Java 11.

Java Modules support
Java modules were introduced in Java 9.
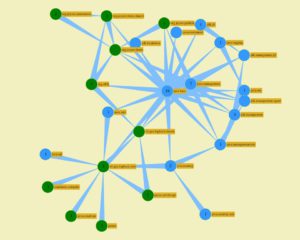
The JZR report of your Java application exposes now its loaded modules and their module graph dependency.
Jeyzer Monitor introduces a new set of monitoring rules to check the Java module names and versions : still time to detect any snapshot or beta version of a Java module in your production application.
Those module checks are also available in the JZR report, along with the other detected events.
The Jeyzer Recorder agent is required to capture the Java module information from the target application.
JZR report tech documentation

Jeyzer 2.2 release
- Java modules full support
Jeyzer Recorder, Analyzer and Monitor are now covering as well the Java modules. - The Jeyzer Publisher and Jeyzer Annotations libraries are now available as Java modules.
Those remain JDK 7 and 8 compatible.

Jira support
Jeyzer 2.1 integrates with Jira Cloud.
Whenever a critical incident happens in your production or QA environment on a Java server, Jeyzer Monitor will automatically create a Jira ticket in the right project and attach all the details of the incident, including the JZR report.
If the Jira ticket exists for such incident, Jeyzer Monitor will update it with a comment and attach the JZR report if required.
Advantages :
The Jeyzer integration with Jira brings a better and strong reactivity.
Your teams will start processing the incident directly from Jira.
Also administrative work time is saved, removing those questions : which project? who is responsible?…
At last, benefit right away from the Jira notification mechanism : ticket could go directly to the right R&D team for example.
Jira publisher tech documentation

Jeyzer 2.1 release
- Jeyzer Monitor : JIRA Cloud integration through the JIRA REST v3 API
Jeyzer Monitor will create or update JIRA items for the important encountered monitoring events. - Jeyzer profiles : monitoring rules do now provide an optional ticket field to store any ticket system reference (like a JIRA ticket id)
- Features demo theme is now aircraft related

The incident management challenge
In this path driven article, we go through the main six reasons of this failure and see how Jeyzer can strongly help.
Based on your current position, choose your path :
