Jeyzer and Java Flight Recorder

Do they share the same playground?

In this article, we will cover Java Flight Recorder and compare it with Jeyzer, looking at their benefits and limitations.

The below study covers a postmortem analysis scenario: a recording is generated and analyzed to detect application issues.
In the end, we will conclude about their best usage.
All materials used in this exercise are available in the resources section.

Jump to the conclusion if you have only 1 minute in front of you.

1. Behind the scene - intro

1.1 Testing environment

Java Flight Recorder (JFR) and Jeyzer were monitoring the Jeyzer Demo Features.

For about 7 minutes, the Jeyzer Demo Features application is playing sequentially a set of functional – air traffic related – and technical scenarios. Those cover multi-threaded actions, a deadlock, an out of memory and a CPU burst cases.
The Jeyzer demo is deployed with the Jeyzer Ecosystem and – optional – with the Jeyzer Recorder.
Its code is obfuscated with Proguard.

1.2 Versions

JFR: Tests were performed on Java LTS versions: the Windows Oracle JRE 8 (1.8.0.241) and Oracle JDK 11 (11.0.6). 
As a reminder, JFR is an event recorder integrated within every JVM.
It is available since Java 7 and became open source in 2018 with the Java 11 release.

JMC: For the analysis, the Windows Amazon Corretto distribution of the JDK Mission Control (JMC 7.1.2) was used.
We discarded the JMC distributed in the above Oracle JDK 8 because it is obsolete and also wasn’t able to read a JFR 11 recording.


Jeyzer: The Jeyzer Recorder 2.3 and Jeyzer Web Analyzer 2.3 were used.
As a reminder, Jeyzer is an incident analysis solution, written in Java.
The Jeyzer Recorder is open source and supports Java 7 and above.
The Jeyzer Web Analyzer requires Java 8 or above.

1.3 Profiles

Recording

JVM is started with the standard JFR profile.  This profile is the default.jfc file stored in the Oracle JDK lib/jfr directory.

The Jeyzer agent is started with the demo-features recording profile which permits to capture a large set of functional and technical figures.

Analysis

JMC does not provide any analysis profile. It is application agnostic.

Jeyzer works with analysis profiles which can be generic, meaning application agnostic, or customized to fit the application needs.
In this exercise, we decided to use the Portal agnostic and generic profile and the Demo features MX profile.

Note: the Portal profile should be the right profile to use when comparing Jeyzer with JMC, but it is also interesting to cover a good custom Jeyzer profile – like the demo one – because it permits to go further in the analysis exercise.

2. Recording

2.1 Usage

What we expect in production: level of requirement is low.
Goal is really to not bother DevOps with any tuning or action to activate the recording.
Therefore, the recording should be activated automatically at startup.

JFR: it is activated through -XX parameters.
It can be controlled at runtime with the JDK jcmd command line tool or with the JDK Mission Control (JMC) client application.
For a post-mortem usage, it generates a recording file, to be read with JMC.

In real time usage, meaning for direct monitoring purposes, JMC will connect to the JVM through JMX.
By experience, this JMX connection gets unresponsive when the application gets in trouble: the JMC application is then becoming “blind”.

Jeyzer: is integrated as a Java agent – the Jeyzer Recorder – to add on the application command line.
It generates a JZR recording which can be accessed in soft real time by the Jeyzer Monitor or analyzed in a postmortem approach through the Jeyzer Web Analyzer.

Action !
JFR and Jeyzer setup went ok on the Jeyzer demo.
We did struggle a bit with the JFR XX parameter options when switching from Java 8 to 11, because some options were deprecated.
For Jeyzer, the demo application is installed with a ready to use Jeyzer Recorder agent .

2.2 Recording archive

What we expect in production: requirement level is high.
Goal is again to not bother DevOps with any recording management.
Recording should not be lost on restart.
It must be therefore archived, compressed and automatically deleted after a few days.
Recording storage should be centralized and standardized whenever possible to facilitate its access.

JFR: manages only one file which grows over time.
His location is specified on the command line.
This is a binary file, composed of optimized chunks.
File seems to be compressed by default on Java 11. It is optional on Java 8.

Jeyzer: generates text files which get compressed periodically (and on shutdown) in a recording archive.
It also generates descriptor files detailing process details, the list of loaded process jars and Java modules in Java 8+.
Usually, the recording archive will cover 6 to 12 hours and will be kept for 5 days.
In a scaling approach, Jeyzer proposes a directory structure to layout the recording of multiple applications.

Action !
On the runtime, we observed that the JFR file was 3 to 4 times bigger than the Jeyzer recording: 817Ko versus 159Ko.
Once manually zipped, the JFR file size went done to 266Ko.
Automatic file renaming on shutdown did not work on Java 11: the archive rolling and cleanup must be then managed externally by an IT script, otherwise it is lost on a restart.

2.3 Data collection

What we expect in production: record the maximum of data strictly required to cover any incident troubleshooting.
This includes system and applicative data: the goal should be to reduce the dependency on log files to the minimum.
The application profiling for performance purposes should be very light or locally focused to not impact the production service.
There should not be loss of data, even if the application is under high stress.

JFR: in standard, it collects categorized events which cover standard metrics like CPU, memory, garbage collection at process and system level.
Threading focus is applied on threads stuck for more than 20ms on a call or a wait.
And from time to time, a thread dump can be performed.
A large variety of technical details is included, which may be too much for a production environment.
Since Java 14, JFR offers an API to publish events from the application.
Since Java 21, JFR can record virtual thread related events

Jeyzer: is capturing a large set of live data (CPU, memory, GC, thread dump, disk space…) at system, process and thread level (CPU, memory).
Jeyzer is also capturing process details in a property card file as well as the list of loaded jar files and Java modules.
At last, Jeyzer is capturing applicative data exposed through MX or through the Jeyzer Publisher API.
The Jeyzer Publisher API permits to emit applicative data and events. Those events are “incident” formatted to expose a reference code, a category (critical, warning, info) and some other optional fields (ticket reference, confidence…).
Since Java 21 and Jeyzer 3.2, Jeyzer can capture virtual threads.

Action !
On JFR, the threading focus could be optimized in standard, for example by filtering JFR internal data.
Typically, the “JFR Periodic Tasks” thread is by nature waiting between collections.
As this thread sleeps more than 20ms, it got recorded 15K times.

Using the default JFR profile, we observe that JFR did collect 1 thread dump on shutdown while the Jeyzer Recorder took 85.
This is insufficient on JFR side although it is too much on Jeyzer (every 5 sec on the demo)!
In both cases, this is a matter of configuration.
In production, thread dumps should be performed every 30s or every minute.

2.4 Data collection configuration

In Jeyzer and JFR, the data collection is configured through profiles.

What we expect in production: recording configuration should be set only once.
When required, important parameters could be overridden through a limited set of environment variables.
Like for the recordings, the configuration should be centralized and standardized whenever possible to facilitate any surgery update.

JFR: comes up with 2 default profiles: standard and profiling.
Those profiles are XML files and can be edited within the JMC profile template editor.
Event sampling period is set at the event level which is excellent but requires some good tuning effort as you must cover every category to set it up to your needs.
JFR requires also some settings on the command line.

Jeyzer: comes up with one standard profile and offers some preconfigured applicative profiles like for Active MQ.
In the latter case, it will access applicative statistics published at the MX level.
Sampling is global and performed periodically.
The Jeyzer configuration framework supports the access to environment variables which permit to isolate a set of important configuration parameters (sampling period, archive directory…).

2.5 Performance

What we expect in production: the recording method should not be invasive.

JFR: announces that it uses less than 1% of the process resources.

Jeyzer: is taking less than 20ms to collect all the data.
Collection time is itself recorded as it constitutes a good performance indicator.

2.6 Security

In the monitoring world, data sensitivity is usually limited to system settings like OS and library versions.
However, the application may expose events carrying private or important business data.

What we expect in production:
No sensitive data should be exposed in clear text in the recording: data should be encrypted.
The configuration changes should be audited.
Whenever possible the application Java classes should be obfuscated.

JFR: relies on the OS security assuming that the flight recording access should be controlled through file permissions.
Anybody accessing the file can read it with JMC or any custom reader.

Jeyzer: permits to encrypt the data while writing on disk, through AES 128 and RSA OAEP keys.
2 mechanisms are proposed to secure the client side and/or the communication channel side.

2.7 Upgrade

What we expect in production: the monitoring tool replacement should be easy and require no manual update.
Whenever possible, the monitoring tool should not be strongly linked to the application lifecycle.

JFR: the above requirement does not make sense as an application is usually certified on a specific Java version.
We noticed that JFR settings evolve over Java releases and may not be compatible from one release to another.
This is sometimes painful when dealing with command line options.
So, the JFR upgrade exercise should be taken with care in R&D when switching to a new JDK version.

Jeyzer: when used in a scaling mode, Jeyzer differentiates the configuration, from the binaries and recording storage place.
As the configuration is backward compatible (until now), the Jeyzer Recorder upgrade is transparent: the binary directory can be replaced safely.

3. Analysis

Looking at a flight recording black box, we perform here a post-mortem analysis.

3.1 Deployment

What we expect in production: something simple to install.

JMC: is either integrated in the JDK 8 or available as a separate application in the following Java versions.
One must take from time to time a new version of JMC as JMC is not forward compatible: for example, you cannot read a JFR generated with Java 11 in JMC 8.

Jeyzer: is deployed either through Docker or with the Jeyzer ecosystem installer.
The Jeyzer Ecosystem installer will allow to configure a few settings like the Tomcat port for the Jeyzer Web Analyzer.
The Docker includes a ready to use Jeyzer Web Analyzer, which can access external storage places such as the analysis working directory and any proprietary profile repository.

3.2 User interfaces

What we expect in the investigation
The analysis tool should:

  • be easily accessible
  • provide intuitive views with navigation facilities
  • provide different levels of reading to adapt to the audience
  • abstract whenever possible the technical information
  • be independent from any recorder version
  • support the deobfuscation

JMC:
By nature, JMC works on technical JVM data and exposes therefore a rather technical user interface.
Although it can manage functional driven data published by the application (Java 9+), there is no functional view which can focus on it in a smart way.
PS: the approach is to instead expose those functional events to external applications through streams (Java 14+).

JMC offers 3 groups of technical views: Java Application, JVM internals and Environment.
On top of it, it exposes an Event Browser and an Automated Analysis Results panel.
The JMC outline view is the entry point to those views: it must be open first and kept aside, locked.

The Threads view is not intuitive and difficult to exploit for someone without any Java technical background.
Colors indicate the type of low level operation but are unfortunately mixed which does not help much : blue color is for example used for file writing and thread sleep.
You must click on the thread name to access its thread line which then takes the full view focus: this is useless as you would like to see it among others.
At last, every thread gets displayed, even if it is doing nothing (wait, accept, sleep..). So this is a kind of spaghetti plate.

Most of the views propose nice time based charts with selection zooming.
Charts get displayed with collected data samples without any clear contextual link : this is quite disrupting in the browsing exercise.

The JMC analysis panel provides system checks and runtime analysis warnings in orange or red.
The “OK results” (green) and the Not applicable ones (grey) are filtered out by default.
All those checks are also available in their respective technical views.

The view configuration settings get stored in the local user profile (.jmc directory).

JCM - Outline view
JCM - Threads view
JCM - Thread mixed colors

Jeyzer:
Jeyzer did make the choice to generate Excel analysis reports, also known as JZR reports.
Therefore, the user interface is the Excel one, which can be used in a collaborative way locally (shared document) or on the cloud (Excel Office live).
The JZR reports are taking advantage of many Excel features to facilitate the navigation and the data browsing like navigation links, data filtering, section folding, and charts.

All JZR reports contains a menu page (the front-page sheet) which gives access to the other sheets, each one covering a particular topic.
Using the Excel back/forward button and a large set of contextual links, the navigation is quite easy inside and between the sheets.

JZR report menu

Several sheet families co-exist to provide time sequences (Gantt chart of the threads of interest or monitoring events), event journals, histograms, profiling views and many static data or listing views.

The report generation is driven by an analysis profile, so these views can be entirely customized to match applicative needs and audience expectations.

JZR report - Locks : orange = locks, red = deadlock
JZR report - Low level operations : wait=blue, green=active... + thread stack display as cell comment

Threads of interest – different views

It worth to mention that Jeyzer is adding an abstraction layer on top of the technical information, which is therefore transposed in many views.

This abstraction permits to simplify considerably the reading.

For example, the Action dashboard (see picture) is providing an abstraction view of the “Long range flight” demo action. The “algae” graph is a profiling view of the action : blue and green circles are respectively high level and low level functions issued from the stack analysis. The bigger the circle is the more the function/operation is observed.
The view combines also the related monitoring events at the top.

Note: this view is generated using the demo analysis profile which permits to get a complete abstraction of the application activity.
Using the portal mode, the abstraction would be limited to the low level profiles such as Java, log4j, spring…

JZR report - Action dashboard

Action !
The major difference resides in the thread display: Jeyzer will show only the active threads to give a clear view of the JVM internal situation, under different technical and functional angles.

On the content side, JMC provides 24 views.
The JZR report generated with the Portal analysis profile offers 20 sheets.
When using the Demo analysis profile, the JZR report goes up to 39 sheets : the additional sheets are covering exploded views of the monitoring events and thread activities. The Demo analysis profile handles also the de-obfuscation. The end result is a crystal clear view of the JVM internals as well as of the application functional situation.

In agnostic mode, JMC and Jeyzer do provide a good standard coverage of the JVM internals.
Jeyzer goes however further as soon as a well tuned analysis profile is put in place.

3.3 Incident detection

What we expect in the investigation
The analysis tool should:

  • detect issues and categorize it
  • perform a technical check
  • provide recommendations
  • provide navigation shortcuts in the analysis results to dig into the details

JMC:
JMC is provided with a set of analysis rules applied on the recording.
Those rules perform both JVM “live” data analysis on many technical topics (GC, CPU, memory, locking) and static checks (recording, configuration and environment).

The rules (57 here) are listed in the Preferences panel of JMC and can be disabled or configured (threshold). It is not documented.

Some checks are superficial: indicating that a system is running with a high number of processes is not really relevant in a production environment.

Analysis results are listed in the Automated Analysis Results view (below).
Each analysis entry gives a clear description and is linked with its originating technical view.

Rules have a rating score out of 100: zero means that rule did not match (rule is displayed in green) and 100 means critical (red). Results in between are considered as warnings (orange).

JMC - List of analysis rules and rule edition
JMC - Analysis results

Jeyzer:
Jeyzer applies a large variety of analysis rules.
Those rules are alive because those are stored into profiles which evolve over time in their own repositories.

Profiles are standard ones (example: Java, log4j, Tomcat…) or applicative (example: Active MQ).

Rules manage technical and functional (relying on the abstraction features) signature lookups.
The rule framework is currently composed of 93 rules: some are unique (like the deadlock, out of memory detection) or instanciable to manage particular contexts (example : a specific functional activity taking too much time).

All the applied rules are detailed in the Monitoring Rules sheet (below), indicating if they did match (green hit).

Rules may be activated under certain conditions called stickers : Windows, java8, performance, code quality…
Rules may also be loaded dynamically based on the library names and versions used by the application.

Like the analysis profiles, rules are stored in XML files, usually versionned in a SCM (Github for the Jeyzer standard rules).
Each rule is unique and identified by a reference code. Examples : JZR-STD-007, DEM-PMV-004.

Jeyzer analysis rules

The analysis results (from the above rules appliance) are events which get classified and possibly time bounded.
Event classification is standard one : info/warning/critical with 5 sub categories in each which permit to fine tune the levels of criticality.
A deadlock will for example be classified as C5, the maximum.

The analysis framework is also open to the application: any application can generate events through the Jeyzer Publisher API which will end up in the JZR recording. As an example, the green events below are generated by the demo application to anounce a test execution.
The JZR reporting framework permits to categorize/dispatch the events in different views if required : for example isolating the static check events (environment, startup parameters…) from the live ones.

Displayed events contain recommendations/remediation instructions.
They also provide contextual links to access the technical views: digging is made easy.

JZR report - Event time sequence
JZR report - Event list : warning/critical filtered

Jeyzer analysis results

Action !

JMC did not spot the deadlock. Indeed, there is no deadlock analysis rule in JMC.
You must open the JMC thread dump view to find it at the bottom of the dump output.

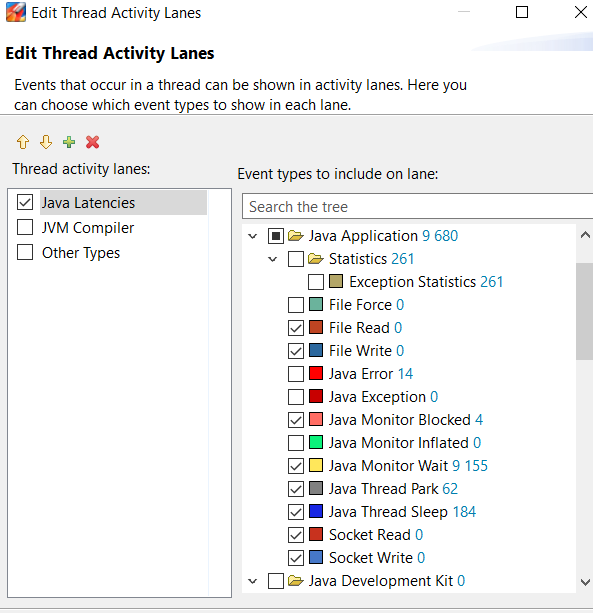
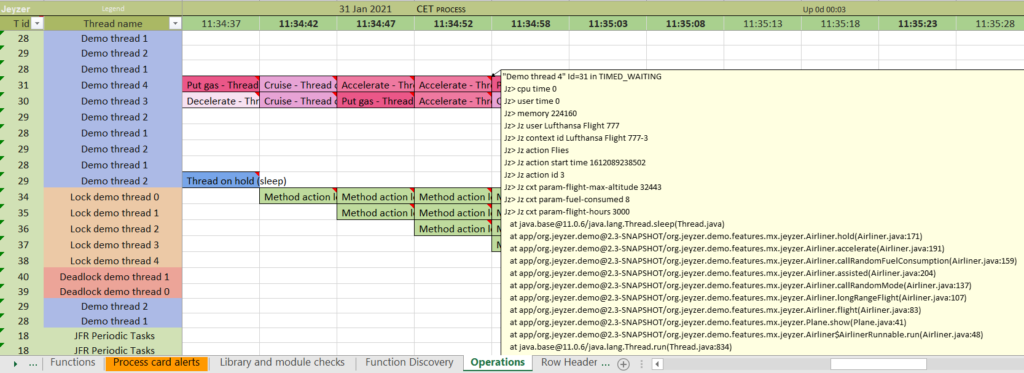
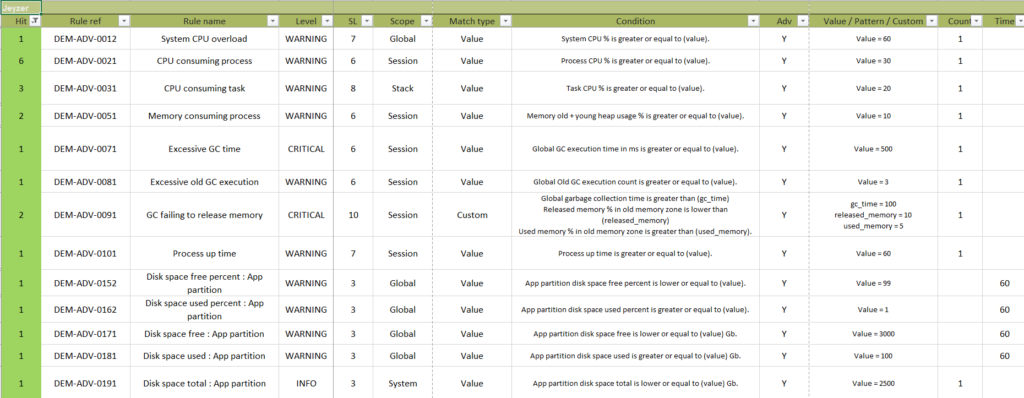
The JZR report has been configured – through the demo advanced profile – to provide 6 event sheets.
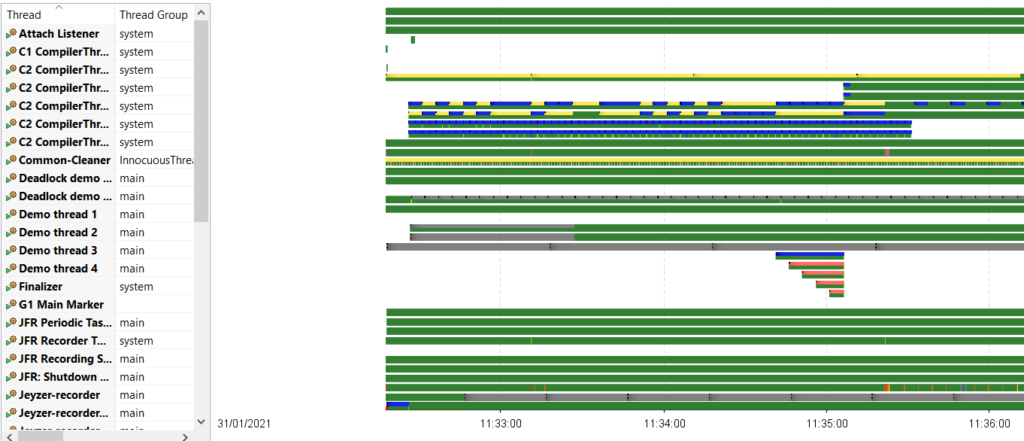
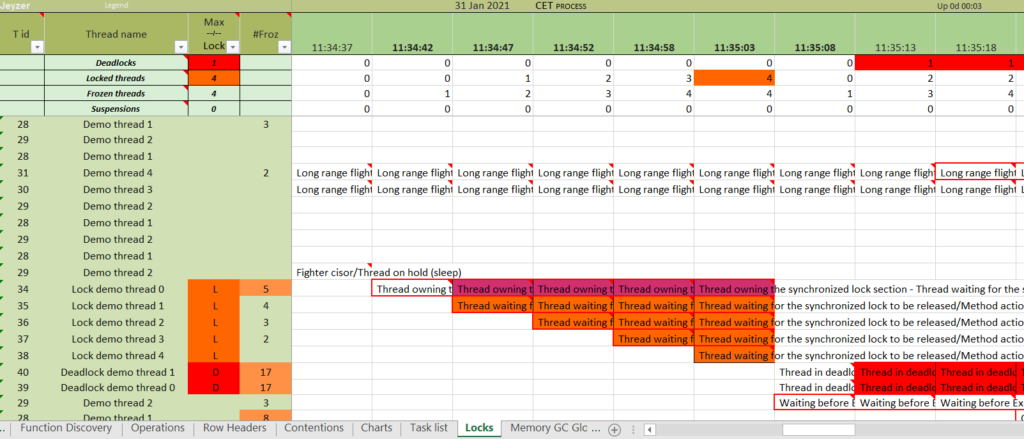
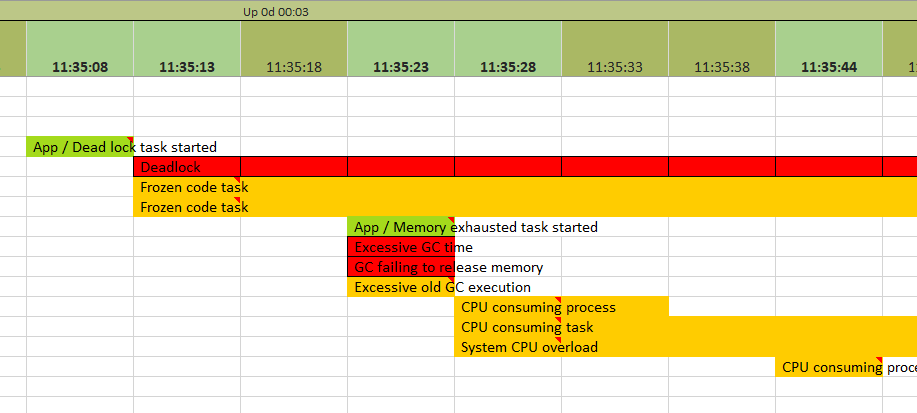
The most interesting one is the monitoring sequence which shows a time sequence of the events (Gantt chart if you prefer) with some process key figures at the top : CPU, heap…

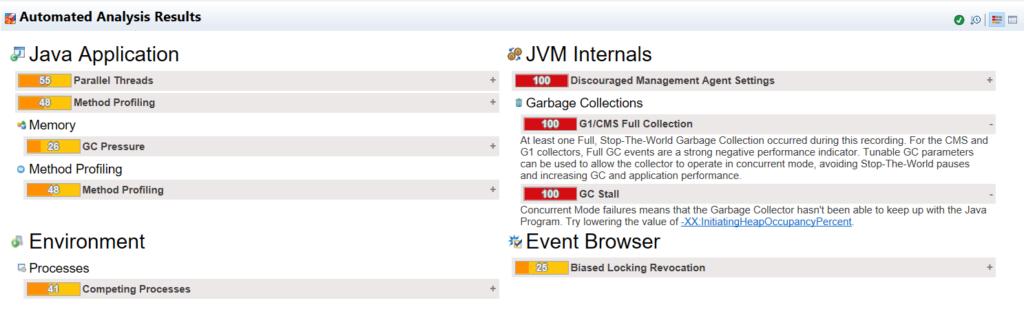
Comparing the analysis results, JMC raised 3 critical events: a full GC collection (Stop the world), a GC stall (Out of memory suspicion),  and a start parameter check (Remote access open without password).

JMC also issued 5 warnings: biased locking usage, competing processes, parallel threads, GC pressure, and method profiling (duplicated in the analysis view).
As mentioned earlier, JMC did not spot the deadlock which is problematic.

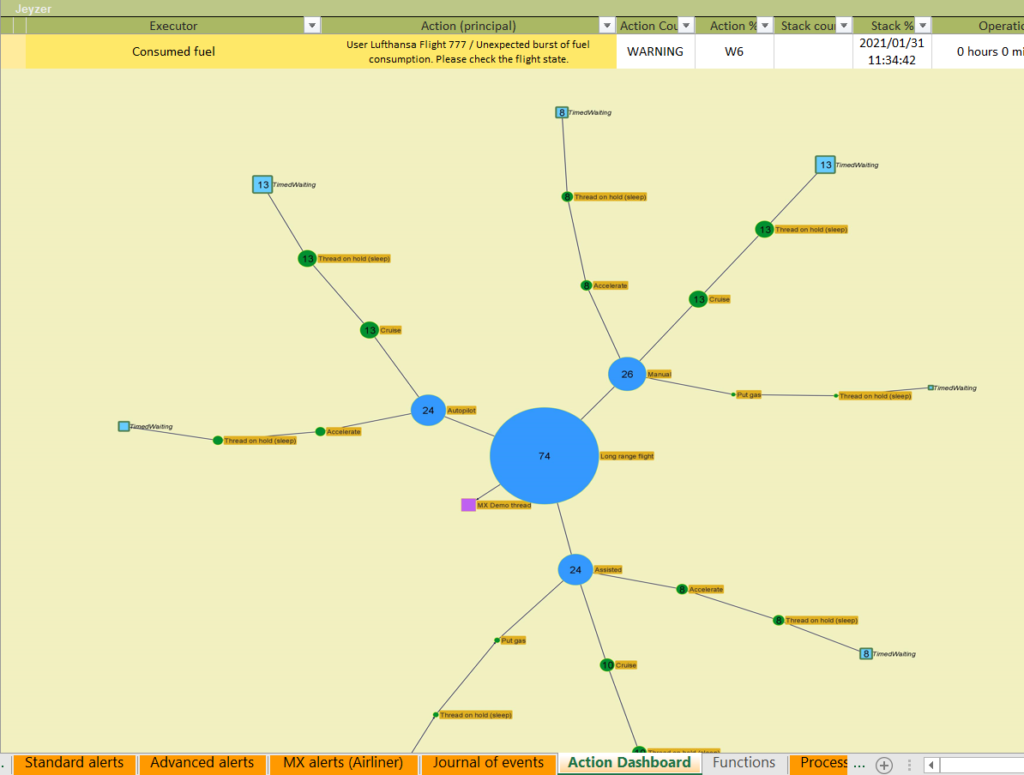
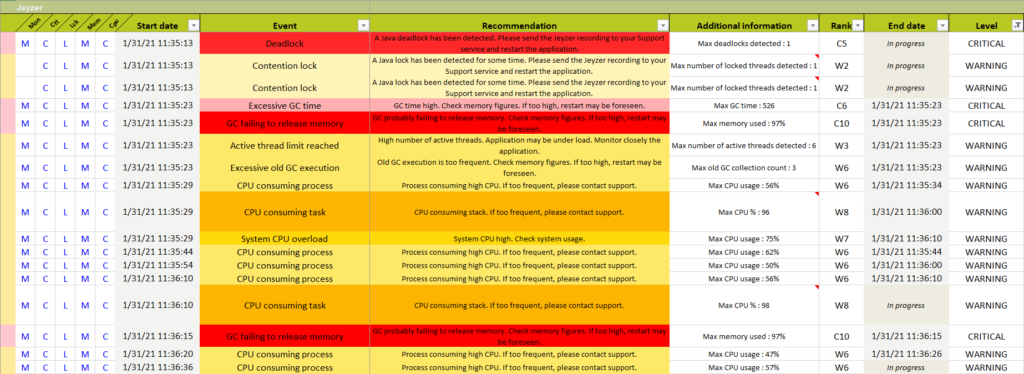
With the Portal agnostic profile, Jeyzer reported 3 critical events : deadlock, GC failing to release memory (Out of memory suspicion) and a frozen thread suspicion. 10 warnings were reported.

With the Demo profile, Jeyzer reported 7 critical events: deadlock, GC failing to release memory (Out of memory suspicion), excessive GC time (stop the world), stack overflow (but rule threshold was artificially low), execution pattern (defective executed code), heap size parameter check (Xmx too low) and flight altitude check (functional data exposed by the demo).
And Jeyzer reported 27 warnings at thread, process and system levels such as CPU consuming tasks.
In total, Jeyzer reported 85 events, generated by 111 rules. A few functional events were also emitted by the demo application.

The “Remote access open without password” reported as critical in JMC is handled with 2 warnings in Jeyzer: “Unsecured JMX communication” and “Lack of JMX authentication”.

Note: as the Jeyzer demo is designed to cover the Jeyzer functionalities, Jeyzer starts with an advantage by covering a maximum number of rules and events.
Also, rules were sometimes configured with unrealistic thresholds to artificially generate an event (ex: free disk space low).

And at last, let’s keep in mind that part of the rules are functional, an aspect which is not covered by JMC.

3.4 Reporting

What we expect in the investigation
The analysis tool should:

  • consolidate results of interest in a report
  • secure the report
  • generate reports in a standard format : pdf, xls, html…

JMC:
Only the JMC analysis result view can be exported into a small HTML page, losing therefore the contextual links.

Jeyzer:
As said, Jeyzer is generating an Excel report, which can be password protected.
Password can be set by configuration or at generation time in the web interface.
Reports are editable, allowing to add notes when sharing it.
Reports can take up to a few Mbs.
Note: Excel report password protection is weak as expert hands can easily crack it.

Conclusion

Analysis

Jeyzer and JMC are basically playing in different yards:
 
JMC is a technical analysis tool and will therefore target a community of developers for one shot usage.

It is strongly tight to the JVM evolution and will hence benefit upfront from the latest Java improvements.

Jeyzer adopts a different approach to target the different actors of the incident support chain: the production DevOps, the support people and the developers.
Jeyzer recipe is basically: data abstraction, activity focus, reporting, deobfuscation and incident signature lookup.
To achieve it, Jeyzer relies on a dynamic set of analysis profiles and analysis rules which are evolving independently from the product.
Jeyzer opens a wider horizon than JMC, to fit as much as possible to organization needs.
Jeyzer can also analyze virtual threads (introduced in Java 21)

Recording

JFR and JZR recordings are almost equivalent in term of content and usage.
One exception : Jeyzer can now capture virtual threads which is not possible in JFR.

Jeyzer adopts a periodic sampling approach while JFR is event buffer driven.

Both do provide extensions to let the application recording its own events.

JFR has the advantage to be JVM integrated, which makes it more trustable by nature.

Security

Jeyzer takes the advantage by providing secured recordings and password protected analysis reports.

The Jeyzer Analyzer and JMC are both free tools, so depending on your needs, you may choose freely one or the other.

Comparison matrix

Feature

Jeyzer

JFR + JMC

Setup time
Archiving
Data coverage
Deobfuscation
Thread analysis
Incident analysis
Profiling
Accessibility
Reporting
Security
Virtual threads