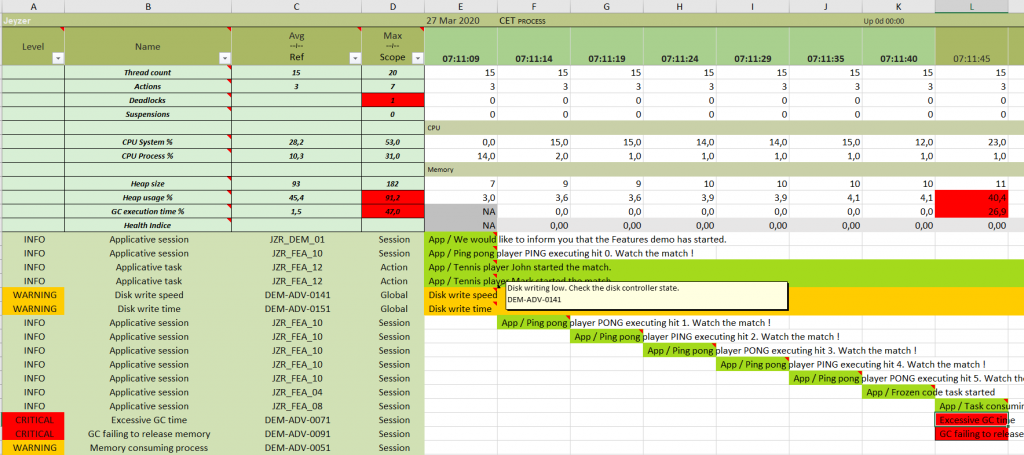
The monitoring sequence sheet displays on a timeline the monitoring events with their criticality.
This is the high level view of the Java process life : the less events it contains, the better it is !!
- Each event gets associated a description, remediation action and event code as a cell comment.
- By navigating and filtering, you can access directly to the vital information.
Ex: On the left, filter the critical red events
Ex : On the top, clicking on the red cell number (deadlock here) will make you navigating to the incident location. - Links permit also to navigate to other Jeyzer sheets to dig the technical aspects, like looking at the actions causing the event.
Monitoring sequence sheets can be configured to focus on specific categories of events such as the applicative events.
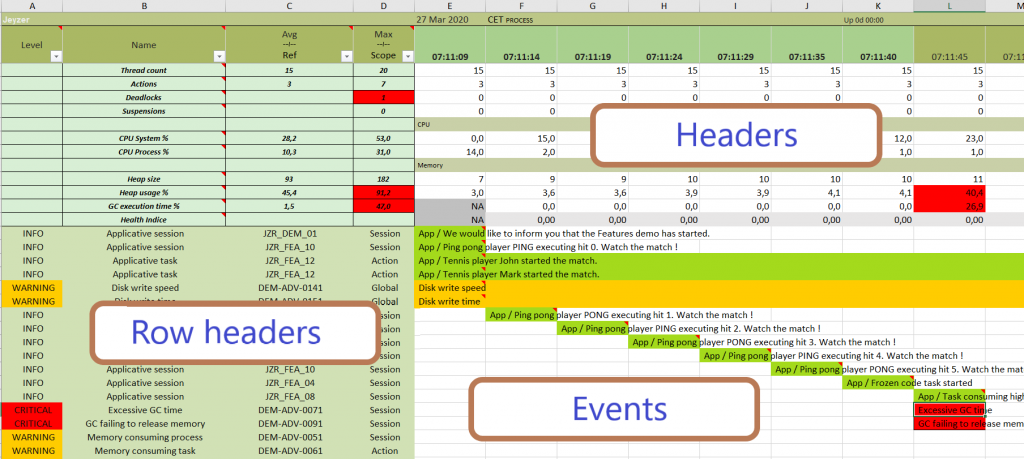
Monitoring sequence is composed of four configurable display zones :
- Headers : system, process or analysis indicators get displayed under the timeline.
Headers can come up with math functions applied to itself, for example to highlight in red an excessive maximum value.
Permits to correlate those indicators with the underlying events. - Row headers : event names and some of their attributes (severity, id..)
- Monitoring events : displayed in a Gantt Chart manner.
Events get “decorated” to display various indicators or highlight facts. - Charts : classic Excel charts linked to the header values.

Configuration
