The Histogram sheets provide a statistical view of the analysis data from different angles.
These angles determine the type of Histogram variant sheet :
- Action principal : analysis data get aggregated at the action principal level.
Know where your main process actions spend their time.
- Action distinct : analysis data get considered at the distinct action level.
This is interesting for the long running actions.
- Function and operation : analysis data is display as is, ordered by frequency.
This gives you the main tendencies.
- Executor and function : analysis data gets aggregated at the executor level.
This is in general higher level than the action principal angle.
Understand for example how an application server pool thread spend their active time.
- Executor : executor data displayed as is.
The most simple histogram. Determines which executor is the most active.
Analysis data covers the functions, operations and contention types.
As an option, the function and contention type graphs can be included which will be adapted to the type of histogram.
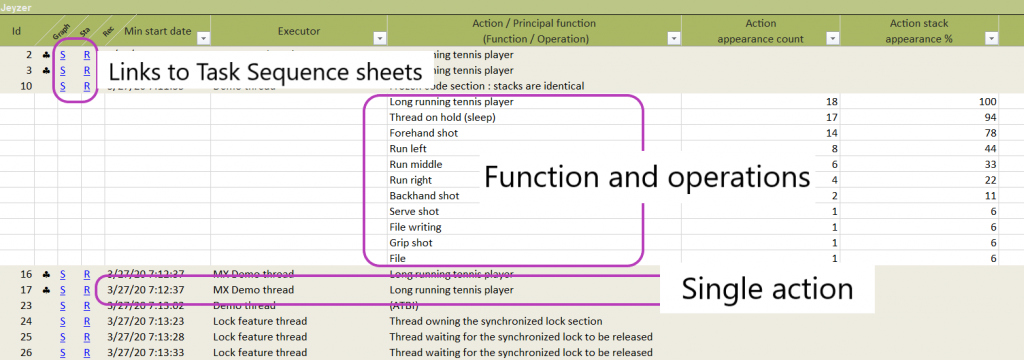
The Action distinct histogram will for example have graph pictures for the major actions.
On the opposite, the Function and operation histogram will provide a global graph picture.
The Action distinct histogram allows also to navigate to the Task Sequence sheets :

