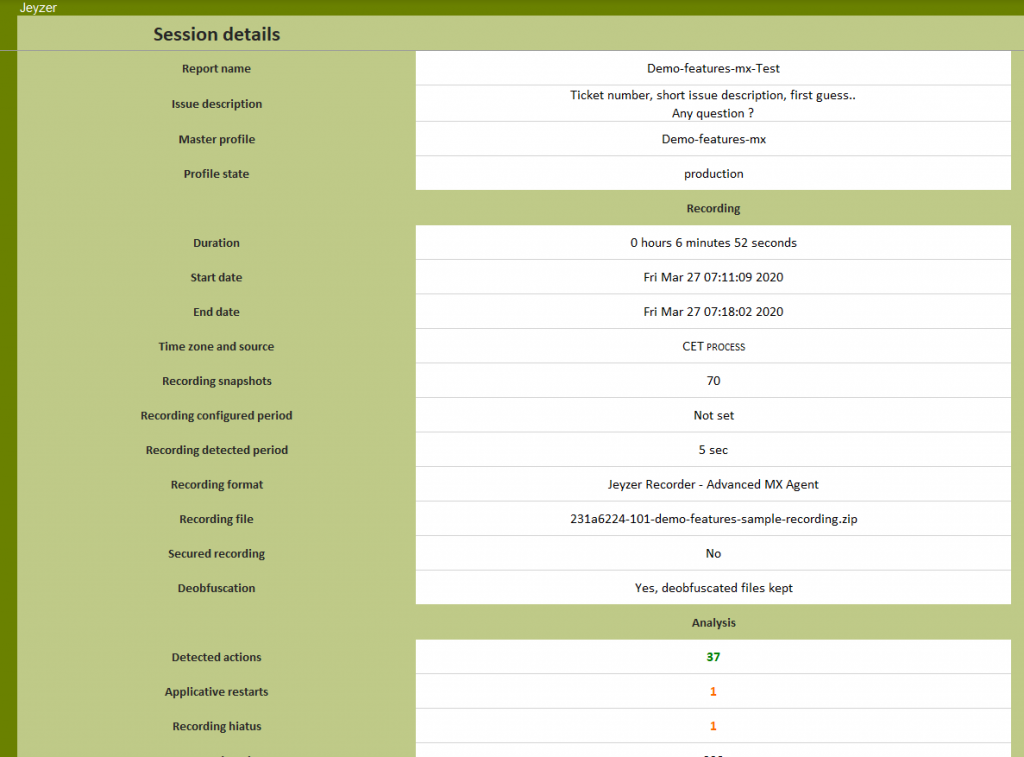
The Session Details sheet displays the analysis session details which cover :
- The major information such as the utilized master profile, the issue context and the report name.
In case of profile redirection, the original profile is given and the final master profile is displayed in orange. - The recording details : date, duration, format, time zone…
- The virtual thread detection and visibility. Since Jeyzer 3.1
Detection means that carriers threads are present.
Visibility means that virtual threads are available in the recording (requires Jcmd). - The analysis statistics : the number of detected actions and stacks, the restarts, the analysis pattern identification hit ratio, the ATBI/OTBI/ETBI global presence and the interest stack minimum size.
The profile redirection support is also indicated as well as the list of used shared profiles (reflecting the monitored application libraries). - The report generation details : the issuer, the display time zone, the generation time, the type of report and its origin.
- The recorder logging details : log levels, automatic log configuration reload, file and console logging state (active/inactive).
- The Jeyzer versions of the Jeyzer Analyzer and possibly the Recorder/Publisher/Agent ones if at the origin of the recording.
