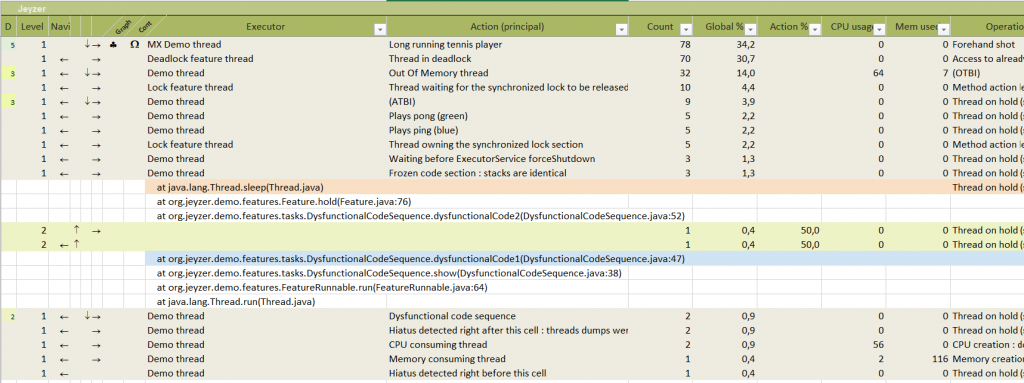
The Action Profiling sheet provides a browsable and advanced view of the analyzed code stacks.
This is a technical profiling tool, applied on the aggregated stacks, in which the developers will identify the Java process bottlenecks.
As its name indicates, this JZR sheet is action focused. It exists in three action related sheet variants :
- Action profiling sheet : actions are content profiled after being merged based on their action principal.
This is the ideal profiling sheet.
- Action distinct profiling sheet : actions are content profiled as is.
This sheet is interesting if you need to focus on particular long actions.
- ATBI profiling sheet : the ATBI sections of code get highlighted within a standard Action profiling sheet (see above).
This sheet is interesting if you need to enrich your analysis profiles manually.
By focusing on the frequent ATBI, you will be able to define new important analysis patterns (functions or operations).
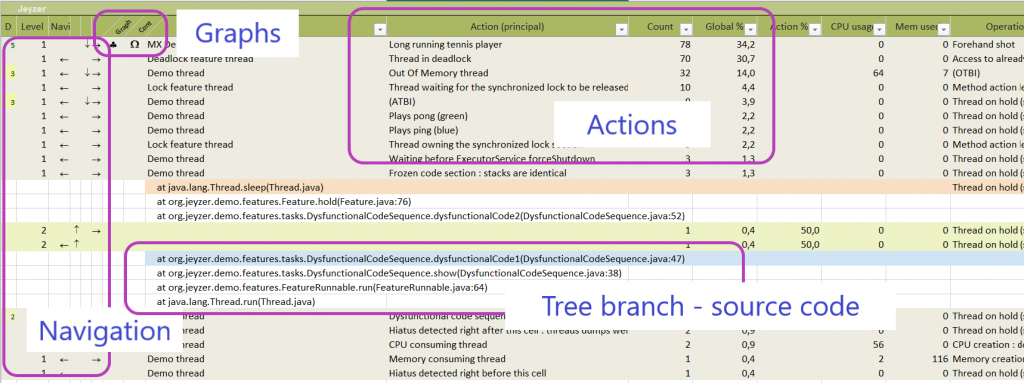
As an option, the function and contention type graphs can be included for the major actions.
When available, the CPU and memory are displayed at the root action level as well as on each profiling tree node.
The more we dive into the tree, the more we must be careful at doing CPU/memory correlations with the browsed source code.
The CPU and memory remain a period measurement compared to a stack snapshot which is instantaneous.
Standard deviation figures are provided to indicate the level of confidence (lower means better).
Each tree node contains also the function, operations and contention types and their principals.
Principals apply on the underlying tree node, which means that going down in the tree will show different principals.
Source code lines get highlighted when matching an analysis pattern.
Arrow navigation links permit to move up/down and laterally in the action stack tree.
Level indicators (depth and current level) are also displayed.
Each tree branch can folded for better visibility.
At last analysis statistics are displayed : percentage of the action presence in the recording, percentage of the tree node presence within the action.

