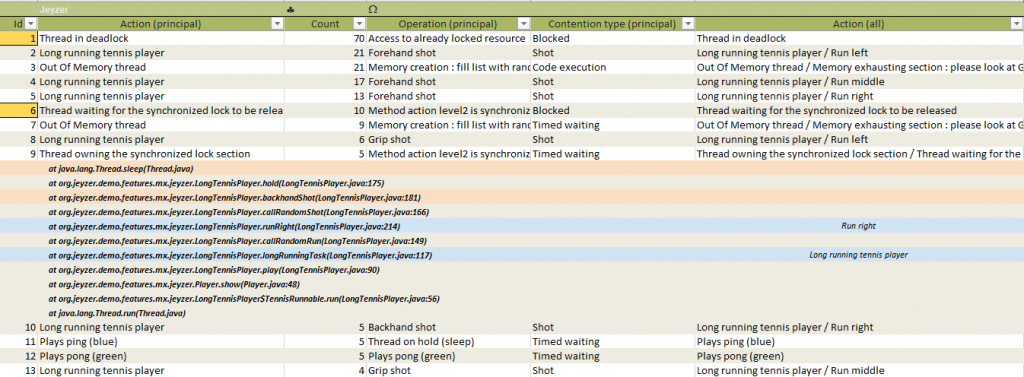
Top Stacks is exposing all the Java active stacks by appearance frequency.
This is a raw profiling view as it permits to quickly spot the process bottlenecks by looking at the major top stacks.
Most of the time, the major top stacks are expected to wait on a condition, which is fully expected : the exceptions are the ones to consider.
This view is very useful as it permits to find the code points to optimize for better performances.
Headers
Each stacks is displayed with a header that regroups its associated analysis data, meaning its principals, functions, operations and contention type and state.
Headers do help to re-situate the stack in its execution context.
Locked stack left margins are displayed in orange (as above).
Stacks
By unfolding the header (as above, stack #9), the Java stack gets displayed with its highlighted functions, operations and locks.
Graphs
Function and contention type graphs can be included.
Symbol links at the top the sheet are provided to access it.
Those graph pictures are global representations of the displayed stacks.
